
Rajen Gala

Price Discovery in the Stock Market

How does price discovery take place in the stock market? Let us say a company makes Rs.1000/- as profit. Also, let us assume the company has 100 shares. So, earnings per share (EPS) i.e., profit / no. of shares = Rs.1000 / 100 = 10. Let us say the price per share in the market is Rs.100/-. Then the P/E would be Price of share / Earnings per share 100/10 = 10. Since P/E = 10, it means a buyer, Mr. Shyam is willing to pay 10 times the company’s annual earnings per share! This means that the buyer would take 10 years to recover his cost of buying. However, 10 years seems a long time to recover his investment. So, what is his motivation for investing? Let us say there is a surge in the demand for the company’s products causing its profits to go up from Rs.1,000.- to Rs.10,000/-! Now what is interesting to observe is that while the profit went up from Rs.1000/- to Rs.10,000/- the number of shares remains the same at 100. Hence, by definition, earnings per share would be Rs.100/-. Since Mr. Shyam invested Rs.100/- for a share, whose EPS has increased from Rs.10/- to Rs.100/-, he is now able to recover his investment within a year. Assuming the P/E remains at was 10 and earnings per share has gone up to Rs.100/-, the price of the share would then be Rs.1000/-. Hence, Mr. Shyam, who paid Rs.100/- per share could sell the same for Rs.1000/- and make a profit of Rs.900/-. But the story does not end here. When people see that a company, which was making Rs.10/- per share sometime back, is now making Rs.100/- per share, they all want  to buy the shares of this company and thus the demand shoots up! And this demand causes the P/E to go up from 10 to let us say 12. When the P/E moves up from 10 to 12, the market price of the shares too moves up to Rs.1200/- from Rs.1000/-. Now Mr. Shyam, who had initially bought a share for Rs.100/-, can now sell the same for Rs.1200/- and make a profit of Rs.1100/-! Thus, we have seen how the price of a share is discovered in the market. It is a function of both the earnings per share, which is the profitability of the company, as well as the sentiments and expectations of the market causing demand to rise, which increases the P/E ratio!

Price Discovery in the Stock Market Read More »
Measurements of Money Supply

We know that ‘Velocity of money’ – which is a term used to denote the number of times a unit of money in an economy changes hands during a certain period, say, one year. Here, by money, economists mean currency and coins in circulation and bank reserves with the central bank. The life of money looks so simply when it is just moving from one hand to another. But what about the actual economy, where countless number of people are using different units of money for small and big transactions? How do we calculate the velocity of money in a real economy? First, the velocity of money can be known only when buy and sell transactions are over. There is no way we can know about the velocity of money on a real-time basis. We calculate velocity of money by dividing the value of the Gross Domestic Product, or GDP, which represents the total value of all goods and services produced by an economy, by the value of money supply. Mathematically, it can be expressed as: Velocity of Money = GDP / Value of Money Supply Remember… Different measurements of money supply would show different velocity. But if you are not too comfortable with the nuances of money supply, then you can just think of money as the value of the total stock of currency notes and coins available in an economy. Now… The different types of money are typically classified as M’s. In the money supply statistics, central bank money (in our case RBI) is M0 while commercial bank money (other national banks) is divided up into M1-M3 components. M0: currency (notes and coins) in circulation and in bank vaults. M0 is usually called the monetary base – the base from which other forms of money are created – and is traditionally the most liquid measure of the money supply. M1: currency in circulation + demand deposits + traveler\’s cheques. M1 represents the assets that can be used to pay for a good or service or to repay debt. M2: The sum of M1 + savings deposits, small denomination deposits & retirement accounts. M3: The sum of M2 + large deposits, Euro-dollar deposits & dollars held in foreign offices of banks. But how does one calculate the different measurements of money supply such as M0, M1, M2, M3 and so on? Here is how… You can choose any of the different measurements of money supply such as M0, M1, M2, M3 and so on. But since different measurements of money supply would show different values, you would get different velocities of money. So, if the value of GDP is, say, Rs10 lakh and the value of the base money or M0 is, say, Rs1 lakh, then the velocity of money would be ten. Likewise, if the value of M3 is, say, Rs2 lakh, then the velocity of money would be five. But you may ask, which one is the true velocity of money, ten or five? It is both. In the present example, ten is the velocity of money in its most liquid form—the currency and coins actually in circulation. As we move up the ladder of M1, M2, and M3, the liquidity of money decreases and so does its velocity. Which brings me to my original point… From one wallet to another, from one shopper to the next, that is the life of money. But we often forget that money is like a lubricant that makes the economy move smoothly. Therefore, if the money is parked in our pocket, and we do not spend it, in effect the economy slows down. Thus, money needs to move and therefore needs velocity (velocity is another word for speed) To Sum Up What: ‘Velocity of money’ is a term used to denote the number of times a unit of money in an economy changes hands during a certain period. How: Velocity of money is calculated by dividing the value of GDP with the value of money in circulation. Why: Money needs to move or have velocity for the economy to move ahead smoothly.

Measurements of Money Supply Read More »

Investment & Consumption

Let us say you have Rs.1,00,000/- with you. With the Rs.1,00,000/- you start a business. The business earns Rs.20,000/- per year. You have added to the value of Rs.1,00,000/- By Rs.20,000/- This is known as investment because you increase the value of the money. Let us say you buy a Car with this Rs.1,00,000/-. If you did not have a car of your own earlier, this car brings comfort and enhances your efficiency. The car takes you to your office in more comfort. You can work more and work better. Your social status increases and your boss is pleased by your performance. He gives you both a promotion and a raise. If you were earning  Rs.50,000/- per month earlier, your new raise has let us say taken it to Rs.75,000/- per month You have thus increased your wealth by 50% per month. This car purchased too can be considered an investment because it helps to increase your wealth. Now let us say you spent Rs.20,000/- on the car by changing its upholstery. Clearly this spending is consumption because the changed upholstery would hardly have an impact on increasing your overall wealth. So, the spending that increases your overall  wealth is an investment  while the spending that does not increase your overall wealth is consumption. Investment and consumption are also two sides of a coin. If you were to buy shares of the company making upholstery which you bought, it would be investment while purchase of the upholstery was consumption. So how are you impacted if the price of upholstery goes up? If the price of the upholstery goes up, you will certainly feel the pinch as a consumer. However, as an investor you may laugh all the way if the share prices go up on account of high demand for upholsteries. Hence, clearly it is important that there is both consumption and investment in an economy for the economy to grow in a balanced manner. On the other hand, even you as an individual need to partake both in consumption and investment to enjoy a balanced life which gives you returns while at the same time allowing you to enjoy some luxuries of life.

Investment & Consumption Read More »

LIBOR

LIBOR is an acronym for London Inter Bank Offered Rate. LIBOR serves as a benchmark that gives an indication of the rate at which banks can borrow from London interbank market for a given period of time. The interbank borrowing is undertaken by financial institutions either to make profits or to cover short-term liquidity shortfalls. Basically, it represents the cost of funds — an average of what banks believe they would have to pay to borrow a “reasonable” amount for a specified short period. LIBOR is compiled by the British Bankers’ Association (BBA) in conjunction with Reuters and are released for 15 different time periods and for 10 currencies every day. How is LIBOR calculated? Every weekday 18 large banks participate in setting LIBOR. The banks individually submit figures for the interest rate at which each bank borrows money from the others. The BBA receives the rates, discards the highest and lowest ones, and then averages the remaining ones The resulting figure is the LIBOR (There are actually multiple rates for different borrowing periods and currencies). LIBOR serves as a key factor in determining a wide range of Interest rates paid by consumers and businesses, including for credit cards, student loans and some mortgages. Why do we need LIBOR? LIBOR was created in the 1980s as banks called for a reliable source to set interest rates for derivatives. The first LIBOR rate was announced in 1986 for three currencies: the U.S. dollar, the British sterling and the Japanese Yen. LIBOR is viewed as the most important benchmark in the world for short-term interest rates. On the professional financial markets LIBOR is used as the base rate for a large number of financial products such as futures, options and swaps. Banks also use the LIBOR interest rates as the base rate when setting the interest rates for loans, savings and mortgages. It currently serves as a benchmark rate for millions of contracts worth billions of dollars written everyday all over the world. Let’s consider an example: Suppose an Indian Company ABC wants to borrow money from the international market. The lender will charge Libor plus X%, depending on the risk profile of the Company ABC and the country, where X is the risk premium. Libor also serves some macro purposes. If LIBOR is rising continuously, it may be an indication of tight liquidity or rising stress in the financial markets. The movement of Libor also reflects market expectation on how the central bank will shape its monetary policy.

LIBOR Read More »

Index Fund

An index fund is a portfolio constituted of stocks belonging to some market index such as the Sensex or Nifty. You can invest in an index fund either through a mutual fund or an exchange-traded fund (ETF). Now… The Sensex, as you may be aware, consists of 30 stocks in proportion to their free-float market capitalization. Likewise, Nifty consists of 50 stocks in proportion to their free-float market capitalization. These stock market indices help us in gauging the overall mood of the market because they capture the price movements of most stocks by market capitalization belonging to different sectors. An index fund tries to track a particular index by including all stocks belonging to that index in its portfolio in the same proportion as used by that index. Okay, but how does it work? Say, for instance, if one stock has a weightage of 9.65% on the Nifty, then an index fund tracking the Nifty would use 9.65% of its funds to buy that stock. If another stock has a weightage of 7%, then the index fund would allocate 7% of its funds for buying that stock. The result is that you have a diversified portfolio, consisting of some of the best-known firms, and your portfolio mimics the rise or fall of the chosen index. What are the other advantages of an index fund? The main advantage of an index fund lies in its cost. Since index funds require only passive fund management, they are much cheaper than more actively managed funds in which portfolio managers try to choose the right stock. The expense ratio, which represents the value of total expenses as a percentage of the value of total assets under management, of most of the index funds in India is usually less than that of more actively managed funds. What about its disadvantages? One of the drawbacks which some of the index funds suffer is in the form of tracking errors. Theoretically, the return produced by an index fund should closely mimic the rise or fall of the concerned index. But due to what we call tracking errors, the fund may sometimes generate a return higher or lower than the actual movement in the index. Tracking errors could happen due to a variety of reasons. Let me quickly tell you about some of them… First, some discrepancies might creep in at the time of allocation of funds itself, leading to greater or lower allocation of funds in different stocks. Second, any change in the composition or weightage of the index requires rebalancing of the portfolio by the fund manager, which increases further the scope for discrepancies. Third, it is often difficult for fund managers to trade at the market closing price, which means that the final value of the index and the value of the index fund portfolio on that day might show some difference. Finally, the fund managers may have to keep some cash ready to take care of redemptions by investors. Spare cash reduces the overall return of the fund. To Sum Up What: An index fund tries to track a particular index so that its returns mimic the rise or fall of that specific index. How: An index fund includes all the stocks of a particular index in its portfolio in the same proportion as used by the index. Why: Index funds are popular due to lower expenses and better performance.

Index Fund Read More »

Exchange Rate & Exports

Many magazines mention that “to improve exports, the central banks need to depreciate the currency.” However, what does it mean and how do exports get a boost by depreciating the currency? To understand how lowering the exchange rate of a currency affects exports of the country, Let us understand through a story…. Mr. A is a mango seller. His mangoes are amongst the best in the market. He sells them for Rs.1000/- per dozen. He also exports mangoes to Mr. M in USA. Let us say the exchange rate is Rs.80/- to a dollar. In other words, it means that if Mr. M were to pay $1, he could buy Rs.80/- from a currency exchange. So, if $1 gets him Rs.80/-, he would need $12.5 to buy Rs.1000/- (1000/80 = 12.5) So, he first purchases Rs.1000/- by paying $12.5. Then he pays the Rs.1000/- to Mr. A for a dozen mangoes. Suddenly one day Mr. M stops purchasing mangoes from Mr. A. On enquiring, Mr. A find out that Mr. M is buying from another country as he is getting them for $10. To sell at $10, it would mean that Mr. A would have to sell a dozen for Rs.800/-. Mr. A realizes that it is impossible to sell at this price. Far from earning profits he would be making a huge loss. Now Mr. A go to the union of mango sellers who send a representative to the government with a request that instead of selling Rs.1000/- for $12.5, they should make the rupee cheaper and sell Rs.1000/- for $10 only. Since the representative is strong and since even exporters of other products had made similar requests, the government relents and makes the rupee cheaper such that Rs.1000/- would be sold for $10. So now for $10 Mr. M can once again buy Rs.1000/- or for $1 he can now buy 100 rupees. Thus, the upwards movement from Rs.80/- to Rs.100/- is the lowering of value of the rupee because now $1 can fetch Rs.100/- instead of the Rs.80/- which was possible before the depreciation ( or value reduction) Since, rupee depreciation brought the value of the Rs.1000/- down to $10 (which Mr. M was paying for mangoes in another country), he now restarts his business relationship with Mr. A. Thus, by depreciating the rupee the Indian government helps exporters like Mr. A.

Exchange Rate & Exports Read More »

Derivative Vs Cash

Why is ‘derivative trading’ a form of high gain – high loss trading with minimum investment? For the sake of understanding, you may replace “futures” with price of share. So, one must take a bet on the movement of the share price at the end of the period. Since one is looking at price movements, one may presume that the share price would perhaps go up or down by a maximum of 10% in this period. The margin money required to take a bet on price movements would be 10%. Let’s say the price of the share is Rs.100/-. Hence, if you want to take a bet on the price movement at the end of say 20 days, you will need to deposit margin money of Rs.10/- for a share of Rs.100/-. Let’s say after 20 days, the share value goes up to Rs.120/-. (For the sake of understanding, we are ignoring the mark to market impact where daily debit / credit entries are made) The buyer of the future makes Rs.10/- (Rs.120/- (–) margin Rs.10/- (–)  original price of Rs.100/- = Rs.10/-) as net profit per share. He thus makes a profit of Rs.10/- on an investment of Rs.10/- which means that the return on investment is 100%. However, please bear in mind that while you can invest in a single share of a company in the spot or cash market, the requirement in the derivative markets is to invest in a diverse basket or lots of the same shares . For example, a basket (which is generally termed used lot size) of say stock “A” would contain 10 stocks per lot. Let’s say the cost of “A” in the spot market is  Rs.100/-; your investment too would be Rs.100/- in the spot market whereas in the derivatives market, you would have to invest in a group of say 10 shares which would be valued at Rs.1000/- but since you only need to invest the margin money of say 10,% your investment would be the same Rs.100/-. However, in this case, you get the opportunity to take a bet on the price movement of 10 shares valued at Rs.100/-. Thus… Investment of single share in spot market Spot / Cash Market Future lot of Shares A Investment in a group of shares in derivative market Futures or Derivative Market Now… Cost of investment is equal to market price of share in spot market. Cost of investment in spot or cash market = margin money for the lot size in derivative market. Rs.100/- for one share. Hence for a Rs.100/- stock the cost of investment is Rs.100/- in spot market. At Rs.100/- per share the cost of the group would be Rs.1000/- but since cost of investment is equal to margin money, which are assuming to be 10%, then cost of investment is Rs.100/- in derivatives market. Rs.100/- as margin for 10 shares. So… In spot market if price rises by 10% you make 10% profit (Rs.10/- on an investment of Rs.100/-) In derivative market if price rises by 10% you make a profit of Rs.100/- on the entire group for your investment of Rs.100/-. Thus, you make a 100% profit. However, in case of a loss, you get badly hit in derivative trading as seen below… In spot market if price falls by 10% to Rs.90/-, you make 10% loss ( Rs.10/- on an investment of Rs.100/-) But in derivative market if price falls by 10% to Rs.90/- per share you make a loss of Rs.100/- on the entire group of shares for your investment of Rs.100/-. Thus, you make a 100% loss as you lose your entire investment in this example. Hence, derivative trading is a high gain and high loss trading as compared to trading in a spot market. Also, in derivative trading you do not deal with a single stock, but in a group of shares. In derivatives trading, you do not take ownership of the group of shares. You only get the rights to bet on price movements of the entire group of shares.

Derivative Vs Cash Read More »

Carry Trade

Rising interest rates come as sad news for those who wish to take a home loan or a car loan. However, rising interest rates bring several opportunities with them as well… And one opportunity in this regard is that of ‘Carry Trade,’ which means borrowing in one market where interest rates are lower and investing in another market where interest rates are high and thereby making a gain. But it is not that simple because it involves two different currencies. One currency is of the country where interest rates are low while the other currency is of the country where interest rates are high. For example… For ‘Carry Trade’ to be profitable, it is crucial that the exchange rates between the countries remain stable. Otherwise instead of a gain one could end up making a serious loss. Thus ‘Carry Trade’ is not devoid of risk. How are ADRs priced? Now, as we always do, let us try and get a better understanding of the concept with the help of an example. Let us assume that the interest rate in US is 2% whereas is in India it is 7% And let us say  someone borrows $100 in USA to invest in India at 7%. It is evident that the differential of 5% (7% – 2%) is the opportunity to make a profit by taking an exchange rate risk. Let us assume the exchange rate is Rs.80/- = $1. Now if someone in the US wants to invest in India, he must invest Indian Rupees for which he has to purchase Indian Rupees. So, if the amount in question is $100, then as per assumed exchange rate of Rs.80/-, it would amount to Rs.8000/-. So, when Rs.8000/- is invested for one year in India at 7%, it would earn an interest of Rs 7% x 8000 = Rs.560/-. Thus, at the end of the period the total amount would be Rs.8560/-. On conversion assuming no change in exchange rate, it would be $ 8560/80 = $107 or net earnings of $7. Now had the investment been made in the USA itself at 2%, it would have earned net $2 only. Hence by participating in carry trade an additional $5 profit opportunity emerged because of differential interest rates between two countries. But here we have made a huge assumption that the exchange rate remained stable across the investment time period. This, however, may not be the case most of the time & in the event of exchange rate variation, the consequence can be painful for the investor. Let us see this by looking at the same example. We had assumed the exchange rate as Rs.80/- = $1 At 7% we saw that the investor in our example made Rs.560/- and the final amount that he received was Rs.8560/-. At the exchange rate of Rs.80/- = $1 he received $107. However, if the rupee grew weaker in the interim period to Rs.90/-  = $1, he would now receive only $ 8560/90 = $95.11. Thus, he would make a loss of nearly $6 instead of a gain of $2 he would have made had he invested in USA itself. This is the currency risk that one must take in carry trade. If the currency of investment becomes weaker the consequences for the investor are painful and if the currency on the other hand were to get stronger its gains too would get stronger. Conversely, if the exchange rate had become Rs.70/- = $1, he would have made USD 8560*/70$ =$122.29 which would have given him a significant gain of $22.29 vs. $2 if he had invested in USA itself. Since ‘Carry Trade’ involves borrowing in one market to fund investments in another market, both ‘gains’ and ‘losses can get magnified due to the currency fluctuations. However, in real life, the moment the traders get a feel that exchange rates are changing unfavorably, they rapidly unwind their positions by withdrawing their investments, and converting them into dollars. This is famously known as ‘Carry Trade Unwinding.’ While I have explained ‘Carry Trade’ in fixed income investment in my example, one must understand that ‘Carry Trade’ also refers to investments in any other asset class like shares, commodity, real estate, etc. in one country by taking leverage from another country.

Carry Trade Read More »

Deflation

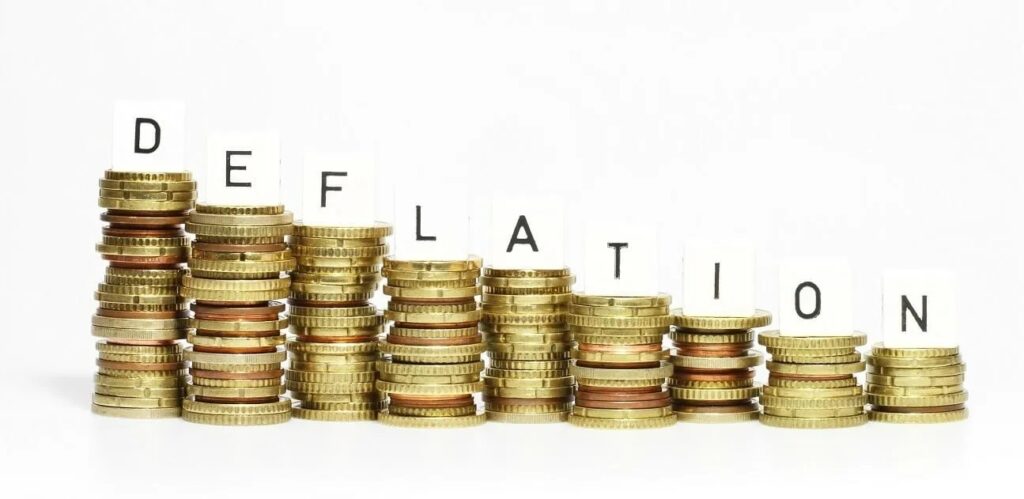
India Inflation Rate reported at 0.27% for the week ending March 14, 2009! This had been the lowest since 1977. Did we go into negative space ? Yes, it was around – 0.36%. Will it happen next time? Did we head for deflation or was its disinflation? What are these terms and how do they affect us? Let us first understand deflation and in this bargain, we will understand disinflation. In economics, deflation is a sustained decrease in the general price level of goods and services. Also… Deflation occurs when the annual inflation rate falls below zero percent, resulting in an increase in the real value of money — a negative inflation rate which we saw in 2009. Inflation reduces the real value of money over time, conversely, deflation increases the real value of money. Now let’s understand disinflation… Deflation refers to a sustained reduction in the level of prices below zero percent based on year-on-year inflation. Disinflation, on the other hand, denotes a slow-down in the inflation rate (i.e. when inflation decreases, but still remains positive). But what are the effects of deflation on the economy? Deflation is caused by a fall in the aggregate level of demand. This means that there is a fall in the going price for goods. Because the price of goods is falling, consumers have an incentive to delay purchases and consumption until prices fall further, which in turn reduces economic activity even further. Lack of demand leads to an increase in the idle capacity, bringing down the rate of investments leading to unemployment and lower disposable income and hence a further fall in demand and increase in loan defaults. This is known as the Deflationary Spiral. So, what can one do about it? An answer to falling aggregate demand is: Stimulus, either from the Reserve Bank of India, by expanding the money supply. Suitable monetary policies such as lowering of interest rates so that the consumers are encouraged to borrow and spend of goods and services. While a fall in prices may sound like good news to most, economists see this as an ominous sign of a collapse in demand in the economy. How does one counteract against deflation? Until the 1930s, it was commonly believed by economists that deflation would cure itself. As prices decreased, demand would naturally increase and the economic system would correct itself without outside intervention. This view was challenged in the 1930s during the Great Depression by the economist Keynes who argued that the economic system was not self-correcting with respect to deflation. What did Keynes say? According to him, governments and central banks had to take active measures to boost demand through tax cuts or increases in government spending. Today, to counter deflation, the Reserve Bank of India (RBI) can use monetary policy to increase the money supply and deliberately induce price rise. Rising prices provide an essential lubricant for any sustained recovery because businesses increase profits and this takes some of the depressive pressures off them. To Sum Up What: Deflation is a sustained decrease in the general price level of goods and services. How: Deflation occurs when the annual inflation rate falls below zero percent and prices continue to fall on a sustained basis. Why: Deflation is caused by a shift in the supply and demand curve for goods and interest, particularly a fall in the aggregate level of demand.

Deflation Read More »

Green Energy

Green energy is a term for energy that comes from renewable sources. The terms ‘green energy’ and ‘renewable energy’ are often used interchangeably, but there is one essential (and sometimes confusing) difference between them. While most green energy sources are also renewable, not all renewable energy sources are considered entirely green. Green energy is often referred to as clean, sustainable, or renewable energy. The energy sources such as sunlight, wind, rain, tides, etc. can be called as green energy. The production of green energy doesn\’t release toxic greenhouse gases into the atmosphere, meaning it causes little or no environmental impact. Renewable energy includes resources that rely on fuel sources that restore themselves over short periods of time and do not diminish. A renewable energy source may not be considered ‘green’ if, for example, power generation that burns organic material from sustainable forests may be renewable, but it is not necessarily green, due to the carbon dioxide produced by the burning process itself. Green energy sources are usually naturally replenished, as opposed to fossil fuel sources like natural gas or coal, which can take millions of years to develop. Green sources also often avoid mining or drilling operations that can be damaging to eco-systems. Most common forms of such energy are as follows, Solar Power is energy from the sun that is converted into thermal or electrical energy. Solar energy is the cleanest and the most abundant renewal energy source available. Solar technologies can harness this energy for a variety of uses, including generating electricity, providing light or a comfortable interior environment, and heating water for domestic, commercial, or industrial use. Wind power harvests the primary energy flow of the atmosphere generated from the uneven heating of the Earth’s surface by the Sun. Therefore, wind power is an indirect way to harness solar energy. Wind power is converted to electrical energy by wind turbines. Hydropower also known as hydroelectric power, this type of green energy uses the flow of water in rivers, streams, dams or elsewhere to produce electricity. Hydropower can even work on a small scale using the flow of water through pipes in the home or can come from evaporation, rainfall or the tides in the oceans. Geothermal energy is type of green power uses thermal energy that has been stored just under the earth’s crust. While this resource requires drilling to access, thereby calling the environmental impact into question, it is a huge resource once tapped into. Geothermal energy has been used for bathing in hot springs for thousands of years and this same resource can be used for steam to turn turbines and generate electricity. Biomass energy, sometimes known as ‘bio energy’, is the energy that is derived from organic matter of plants and animals. Biomass in the form of dead plants, trees, grass, leaves, crops, manure, garbage, animal waste can be a great source of alternative fuels that can be used to replace fossil fuels. Plants make use of a process called photosynthesis that converts energy from the sun into chemical energy. This energy gets transferred to animals when they eat plants. When plants and animal waste are burned, the carbon dioxide and waste stored inside them are released back into the atmosphere. Biofuels energy gets transferred to animals when they eat plants. When plants and animal waste are burned, the carbon dioxide and waste stored inside them are released back into the atmosphere. Green energy is important for the environment as it replaces the negative effects of fossil fuels with more environmentally-friendly alternatives. Green energy can also lead to stable energy prices as these sources are often produced locally and are not as affected by geopolitical crisis, price spikes or supply chain disruptions. The economic benefits also include job creation in building the facilities that often serve the communities where the workers are employed. Due to the local nature of energy production through sources like solar and wind power, the energy infrastructure is more flexible and less dependent on centralised sources that can lead to disruption as well as being less resilient to weather related climate change. These facts suggest that green energy is the future, which can make it a long-term investment option.

Green Energy Read More »