Financials

Liquidity Ratio

These days most people go for regular health check-ups in order to stay fit. During one such check-up, my friend was told that his blood sugar levels were higher than the normal range. Thus, the reading of his sugar level became an indicator that he should change his lifestyle, diet and exercise plans. Just as there are indicators which give us an idea of our health, there are indicators like Liquidity Ratio that give us an idea about our financial health too. One such liquidity ratio also known as acid test ratio which gives us an idea about how well prepared, we are to meet our emergency needs or short-term obligations. To illustrate, it indicates the number of months you can manage your expenses in case of a job loss where income stops. Liquidity Ratio = Liquid Assets/ Immediate Monthly Expenses Liquid Assets include any cash that you may have stashed away in your savings bank accounts or savings in fixed deposits or liquid category mutual funds. Equities & equity related mutual fund investments are usually not seen as liquid assets as they are subject to market movement. Immediate monthly expenses include rent payment or equated monthly instalments (EMIs), if any. In other words, expenses that cannot be delayed. On the other hand, insurance premiums or living & lifestyle expenses constitute outflows that can be delayed by a certain degree. For example, if your liquid assets are Rs 6 lacs. Say your monthly expense is Rs 1 lac. Then your liquidity ratio as per the formula would be 6/1 = 6. A liquidity ratio of 6 means that you can provide for 6 months of expenses without earning an income. So, what is the right number for the liquidity ratio? It is dependent from individual to individual. If a person has a large income and relatively low expenses, he need not have a high liquidity ratio. On the other hand, if a person does not have a steady flow of income, he should have a higher liquidity ratio. Considering a Company, a liquidity ratio is a type of financial ratio used to determine a company’s ability to pay its short-term debt obligations. The liquidity ratio affects the credibility of the company as well as the credit rating of the company. If there are continuous defaults in repayment of a short-term liability then this will lead to bankruptcy. Hence this ratio plays important role in the financial stability of any company and credit ratings. When analyzing a company, investors and creditors want to see a company with liquidity ratios above 1.0. A company with highly liquidity ratios is more likely to be approved for credit.

Liquidity Ratio Read More »

Nifty Indices

The indices are indicators that reflect the performance of a certain segment of the market or the market as a whole. A stock market index is created by selecting certain stocks of similar companies or those that meet a set of predetermined criteria. These shares are already listed and traded on the exchange. Each share market index measures the price movement and the performance of the shares that constitute that index. This essentially means that the performance of any stock market index is directly proportional to the performance of the underlying stocks that make up the index. In simpler terms, if the prices of the stocks in an index goes up, that index, as a whole, also goes up. Under Nifty structure there are 17 broad market indices   Other Nifty Indices   NIFTY Sectorial Indices 1 Nifty Auto 9 Nifty Pharma 2 Nifty Bank 10 Nifty PSU Bank 3 Nifty Consumer Durables 11 Nifty Private Bank 4 Nifty FMCG 12 Nifty Realty 5 Nifty IT 13 Nifty Financial Services 6 Nifty Media 14 Nifty Financial Services 25/50 7 Nifty Metal 15 Nifty Healthcare 8 Nifty Oil & Gas     NIFTY Thematic Indices 1 Nifty 100 Liquid 15 16 Nifty MNC 2 Nifty Aditya Birla Group 17 Nifty Mobility 3 Nifty Commodity 18 Nifty Non-Cyclical Consumer 4 Nifty Corporate Group Indices 19 Nifty PSE 5 Nifty CPSE 20 Nifty Service Sector 6 Nifty Energy 21 Nifty Shariah 25 7 Nifty ESG Index 22 Nifty Shariah Indices 8 Nifty Housing 23 Nifty SME Emerge 9 Nifty India Consumption 24 Nifty Tata Group 10 Nifty India Defence 25 Nifty Tata Group 25% Cap 11 Nifty India Digital 26 Nifty Transportation and Logistics 12 Nifty India Manufacturing 27 Nifty100 Enhanced ESG 13 Nifty Infrastructure 28 Nifty100 ESG Sector Leader 14 Nifty Mahindra Group 29 Nifty50 Shariah 15 Nifty Midcap Liquid 15 30 Nifty500 Shariah   NIFTY Strategy Indices 1 Nifty Alpha 50 11 Nifty100 Alpha 30 2 Nifty Dividend Opportunities 50 12 Nifty100 Equal Weight 3 Nifty Dynamic Asset Allocation Indices 13 Nifty100 Low Volatility 30 4 Nifty Equity Savings 14 Nifty100 Quality 30 5 Nifty Growth Sectors 15 15 Nifty200 Momentum 30 6 Nifty High Beta 50 16 Nifty200 Quality 30 7 Nifty Low Volatility 50 17 Nifty50 Equal Weight 8 Nifty Midcap 150 Quality 50 18 Nifty50 Value 20 9 Nifty Multi-Factor Indices 19 Nifty500 Value 50 10 Nifty Quality Low Volatility 30   NIFTY50 Variants 1 Nifty50 USD 6 Nifty50 TR 2x Leverage 2 NIFTY50 Dividend Points 7 Nifty 50 Arbitrage 3 Nifty50 PR 1x Inverse 8 Nifty 50 Futures 4 Nifty50 PR 2X Leverage 9 Nifty50 Equal Weight 5 Nifty50 Tr 1x Inverse National Stock Exchange of India (NSE) is the world’s largest derivatives exchange by trading volume (contracts) as per the statistics maintained by Futures Industry Association (FIA) for calendar year 2021. NSE is ranked 4th in the world in the cash equities by number of trades as per the statistics maintained by the World Federation of Exchanges (WFE) for calendar year 2021.

Nifty Indices Read More »

Nifty 50

The Nifty 50 is a diversified 50 of the blue chip largest and liquid Indian companies listed on the National Stock Exchange, accounting for 13 sectors of the economy. Nifty 50 Index has an inception date of November 3, 1995. The index was constructed using a unique concept of impact cost, which helps in the selection of highly liquid stocks and results in the creation of a replicable index. The NIFTY 50 index is a free float market capitalisation weighted index. The index was initially calculated on a full market capitalisation methodology. On 26 June 2009, the computation was changed to a free-float methodology. It is used for a purpose such as benchmarking fund portfolios, index-based derivatives and index funds. NIFTY 50 is owned and managed by NSE Indices Limited. NSE Indices is India\’s specialised company focused upon the index as a core product. Derivatives Trading in call and put  options on the Nifty 50 are offered by the NSE. The exchange offers weekly as well as monthly expiry. Nifty Next 50 NIFTY Next 50, also called NIFTY Junior, is an index of 50 companies whose free float market capitalisation comes after that of the companies in NIFTY 50. NIFTY Next 50 constituents are thus potential candidates for future inclusion in NIFTY 50. Do you Know There are 12 companies who are part of Nifty 50 since inception. Across 25 years, there have been 101 inclusions in Nifty 50, averaging 4 per year. There are 7 ETFs based on Nifty 50 listed internationally having AUM of USD 1.07 Bn. Derivatives on Nifty 50 index are traded on 3 exchanges globally.  The flagship \’NIFTY 50\’ index is widely tracked and traded as the benchmark for Indian Capital Markets.  

Nifty 50 Read More »

Bottom Fishing

There was a man named Hari who was taking a stroll when he came across a bunch of ragpickers. They were scanning through piles of garbage and waste. He realized they were searching for valuable stuff that sometimes accidently makes their way into the garbage. This practice of the ragpickers reminded him of a term in investing known as Bottom Fishing. If we look at the stock market, the stock market\’s health is largely dependent upon NEWS flow reflecting the state of the macro-economic environment. In other words, a good macro-economic environment leading to good and positive NEWS flow improves sentiments of investors. No investor would like to invest when the economic environment is not conducive because the risks of investing in adverse conditions are rather high. Let\’s say a country which had favorable political conditions, suddenly finds itself in the throes of terrorism. Under such circumstances the stock market plummets to a level that is commonly referred to as the bottom. At such times, the stock prices of perfectly healthy and robust companies also tend to test the bottom. The sentiments are so discouraging that everything is viewed from the same pessimistic lens and all companies good and bad get painted by the same gloomy and gray brush. However, such are times that present the best opportunities to astute investors. There are opportunities to identify stocks that are quoting at prices below their intrinsic values. Such under-valued stocks can yield handsome returns when the negativity in the macro-economic environment alleviates. Identifying such valuable stocks in what is popularly known as Bottom Fishing which translates to fishing for good companies when the markets bottom out. It helps investors generate meaningful returns while containing the risks. Buying undervalued assets brings in a good margin of safety, making it a very successful strategy for investors. Risks of Bottom Fishing Though bottom fishing can be extremely rewarding, it does carry risks as not always the beaten-down assets return to their perceived intrinsic value. The assets may also decline further in price, damaging the investors capital. When the damage to the price of the asset is irreparable, it keeps on declining in price and never comes back to the investor’s buying price. In some asset classes like stocks and bonds, investments may lose all of their value, leaving the investors with damaged merchandise. Such investment decisions might end up risking the entire returns of the portfolio.  

Bottom Fishing Read More »

Stagflation

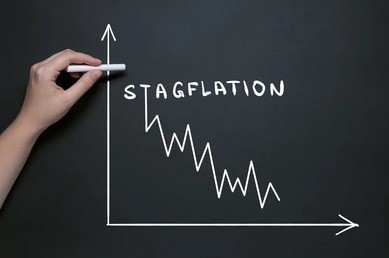
Stagflation is characterized by slow economic growth and relatively high unemployment or economic stagnation, which is at the same time accompanied by inflation. Stagflation is a period of rising inflation but falling output and rising unemployment. Stagflation is often a period of falling real incomes as wages struggle to keep up with rising prices. A degree of stagflation occurred in 2008, following the rise in the price of oil and the start of the global recession during the collapse of Lehman Brothers. Stagflation is difficult for policy makers. For example, the Reserve Bank can increase interest rates to reduce inflation or cut interest rates to reduce unemployment. But, they can’t tackle both inflation and unemployment at the same time. Causes of Stagflation When Oil price rises it causes a rise in business costs, transport will become more expensive and short run aggregate supply will shift to the left. This causes a higher inflation rate and lower GDP. If trade unions have strong bargaining power they may be able to bargain for higher wages, even in periods of lower economic growth. Higher wages are a significant cause of inflation. If an economy experiences falling productivity, workers becoming more inefficient; costs will rise and output fall. If there is a decline in traditional industries, we may get more structural unemployment and lower output. Thus we can get higher unemployment, even if inflation is also increasing. If there is disruption to supply chains, there prices will start rising. The supply shock will also cause decrease in unemployment. Moderate stagflation People may talk about stagflation if there is a rise in inflation and a fall in the growth rate (i.e. the economy is growing at a slower rate. This is less damaging than higher inflation and negative growth. But, it still represents a deterioration in the trade-off between unemployment and inflation. Currently, inflation is very high, and economists are worried about economic growth because of the war in Ukraine as well as lockdowns in China and supply chain disruptions related to the Covid-19 pandemic. Are we in a period of stagflation now? Not necessarily. According to the ministry of statistics and programm implementation, India\’s FY22 GDP growth is likely to be 8.9 percent this year. We are not in a situation of stagflation as of now. The growth may come down from whatever was being projected earlier, but it is still likely to be closer to 7 odd percent. Expectation is highly on manufacturing seeing bigger share in GDP in India and even we can expect India to gain market share in global goods exports so that it is not just dependent on the global beta of trade growth improving, but it gets the alpha of increasing market share in global goods exports.

Stagflation Read More »

Cash Reserve Ratio (CRR)

The Reserve Bank of India mandates that banks store a proportion of their deposits in the form of cash so that the same can be given to the bank’s customers if the need arises. The percentage of cash required to be kept in reserves, vis-a-vis a bank’s total deposits, is called the Cash Reserve Ratio. The cash reserve is either stored in the bank’s vault or is sent to the RBI. Banks do not get any interest on the money that is with the RBI under the CRR requirements. Cash Reserve is a  bank regulation that sets the minimum reserves each bank must hold by way of customer deposits and notes. These deposits are designed to satisfy cash withdrawal demands of customers. Cash Reserve Ratio is also called the Liquidity Ratio as it seeks to control money supply in the economy.  Effects on money supply… CRR is used as a tool in monetary policy, influencing the country’s economy, borrowing and interest rates. CRR works like brakes on the economy’s money supply. CRR requirements affect the potential of the banking system to create higher or lower money supply. Let us now understand how CRR requirements affects the potential of banks to ‘create’ higher or lower money supply. CRR and liquidity… For e.g. say…the CRR is pegged by RBI at 10%. if a bank receives 100 as deposit, then they can lend Rs.90 as a loan and will have to keep the balance Rs.10 in customer’s deposit account. Now, the borrower who has received Rs.90 as a loan will deposit the same in his bank. The borrower’s bank will now lend out Rs.81 (Rs.90 X 90%) and keep Rs.9 in his deposit account. As this process continues, the banking system can expand the initial deposit of Rs.100 into a maximum of Rs. 1000 (Rs.100 + Rs.90 + Rs.81…= Rs.1000)  Similarly… For e.g. say…the CRR is pegged by RBI at 20%. if a bank receives Rs. 100 as deposit, then they can lend Rs.80 as a loan and will have to keep the balance Rs.20 in customer’s deposit account. Now, the borrower who has received Rs.80 as a loan will deposit the same in his bank. The borrower’s bank will now lend out Rs.64 (Rs. 80 X 80%) and keep Rs.16 in his deposit account. As this process continues, the banking system can expand the initial deposit of Rs.100 into a maximum of Rs. 500 (Rs.100 + Rs.80 + Rs.64….=Rs.500) So… The higher the cash reserve (CRR) required, the lower the money available for lending. Every time the borrowed money comes into a deposit account of a customer, the bank has to compulsorily keep a part of it as reserves. This reduces credit expansion by controlling the amount of money that goes out by way of loans. This directly affects money creation process and in turn affects the economic activity. Hence central banks in the world increase the requirement of cash reserves whenever they feel the need to control money supply. To sum it up… CRR is increased to bring down inflation which happens due to excessive spending power. Spending power is augmented by loans – if money that goes out as loans is controlled, inflation can be tamed to some extent. Conversely, if the government wants to stimulate higher economic activity and encourage higher spending to achieve economic growth, they will lower CRR. A lower CRR allows the bank to lend more money and will fuel consumption and spending. Thus, banks indirectly enjoy the power to create more money. The Cash Reserve Ratio in India is decided by RBI’s Monetary Policy Committee in the periodic Monetary and Credit Policy. The Reserve Bank of India takes stock of the CRR in every monetary policy review, which, at present, is conducted every six weeks. CRR is one of the major weapons in the RBI’s arsenal  that allows it to maintain a desired level of inflation, control the money supply, and also liquidity in the economy.

Cash Reserve Ratio (CRR) Read More »

Fiscal Deficit

The difference between total revenue and total expenditure of the government is termed as fiscal deficit. It is an indication of the total borrowings needed by the government. While calculating the total revenue, borrowings are not included. The government needs money for its huge expenses. We can broadly divide government expenses into two types: Revenue expenses Capital expenses The money spent by the government for paying salary to its staff is revenue expense and the money spent for constructing a hospital is capital expense. So how does the govt. meet these expenses? The government finances its expenses by Revenue by direct and indirect taxes Revenue by non-tax means include Revenue receipts: These include dividends received from public sector companies, fees, fines, forfeitures etc. Capital receipts: These include sale of PSUs, recovery of loans, borrowings of the government. Revenue receipts are recurring in nature like the salary you earn while capital receipts are occasional in-flows like the proceeds you may receive on selling your house. So where is the deficit? The expenses that the government incurs is always more than the income it makes. This difference or deficit is known as “Fiscal Deficit”. It is expressed as a percentage of GDP. The financing of this deficit is known as “deficit financing”  So how is this deficit financed? Through government borrowings. It is due to this reason we had included borrowings of the government as revenue in one of our earlier slides. OR Through printing of additional currency notes.  Which is a better option then? Borrowing money from the market is a better option because if the government were to print more notes it would increase supply of money in the economy thereby reducing its “buying power” and causing inflation. Inflation would hurt one and all making the government un-popular. Therefore, borrowing from the market is a better option as it does not alter money supply. But this too cannot go on endlessly. Government borrowings too have a limit. Borrowing money from the market cannot be an endless strategy purely because there is limited money in the market and needs to be made available for other borrowers as well. Too much of borrowings will drive up interest rates making credit expensive and thereby putting pressure on prices. Hence, the only way to control the deficit in the long run is by spending less and earning more.  

Fiscal Deficit Read More »

Base Effect

The base effect occurs whenever two data points are compared as a ratio where the current data point or point of interest is divided or expressed as a percentage of another data point, the base or point of comparison. The base effect can lead to distortion in comparisons and deceptive results, or, if well understood and accounted for, can be used to improve our understanding of data and the underlying processes that generate them. Inflation is often expressed as a month-over-month figure or a year-over-year figure. Base effect a riddle for economic indicators. It is a term generally used in inflation. It refers to the impact of an increase in the price level (i.e., previous years inflation) over the corresponding rise in price levels in the current year (i.e., current inflation). If the inflation rate was low in the corresponding period of the last year, then even a small increase in the price index will give a high rate of inflation in the current year. Similarly, if there is a rise in the price index in the corresponding period of last year and recorded high inflation, then an absolute increase in the price index will show a lower inflation rate in the current year. To understand base effect, we need to revisit Inflation to understand its implication. Inflation is the ‘rate of change’ of prices. If for a certain week, the inflation figure is at 12%, it means the price index is 12% higher as compared to the corresponding week in the previous year. Here’s an example…… To explain base-effect: Week 30 2020 – index was at 100. Week 31 2020 – index was at 98. Week 30 2021 – index is at 112. (Figures 100,98,112 are just an example) Thus, inflation is 12% (denoting a 12% increase in prices). Now Week 31 2021 – index continues to be at 112. So as compared to the base exactly one year ago (week 31 2020) inflation would be at 14.29% [(112 -98)/98 ]*100 Now though the index continued to be the same as what it was in week 30 of 2021, the inflation went up as the corresponding base was lower in the previous year. So even if the prices of the goods that represent the index did not change as compared with the previous week ( i.e., week 31- 2021 over week 30- 2021), the inflation figure changed due to the effect of the previous year. This is the base-effect for inflation. Which means…. Every reported inflation number is with reference to the inflation number  that existed exactly one year back re-based to 100. To make it simpler, if we say inflation is 5%, it means that if the price of goods comprising the inflation basket was 100 exactly a year back, it is 105 today. To sum up The base effect relates to inflation in the corresponding period of the previous year: Thus, if the inflation rate was too low in the corresponding period of the previous year, even a smaller rise in the Price Index will arithmetically give a high rate of inflation now. On the other hand, if the inflation rate was too high in the corresponding period of the previous year a large price rise might land up presenting itself as minor rise in inflation due to the base effect. Thus, the term ‘base effect’ has a lot of impact while ascertaining inflation numbers and can sometimes appear to misrepresent ground realities because it is dependent on a number that existed one year back.

Base Effect Read More »

Bank Deposit Insurance

Deposit Insurance and Credit Guarantee Corporation (DICGC) DICGC is a subsidiary of Reserve Bank of India which provides insurance of deposits and guaranteeing of credit facilities to all such banks registered under the guidelines of the RBI Act. The DICGC insures all deposits such as Savings, Fixed, Current, Recurring, etc. All commercial banks including branches of foreign banks functioning in India, local area banks and regional rural banks are insured by the DICGC. All State, Central and Primary cooperative banks, also called urban cooperative banks, functioning in States / Union Territories which have amended the local Cooperative Societies Act empowering the Reserve Bank of India (RBI) to order the Registrar of Cooperative Societies of the State / Union Territory to wind up a cooperative bank or to supersede its committee of management and requiring the Registrar not to take any action regarding winding up, amalgamation or reconstruction of a co-operative bank without prior sanction in writing from the Reserve Bank are covered under the Deposit Insurance System. At present all co-operative banks other than those from the States of Meghalaya, and the Union Territories of Chandigarh, Lakshadweep and Dadra and Nagar Haveli are covered under the deposit insurance system of DICGC. Primary cooperative societies are not insured by the DICGC. Each deposit is insured up to a maximum of Rs.5,00,000/- (Rupees Five Lakhs Only) for both principal and interest amount held by the investor. The deposits kept in different branches of same bank are aggregated for the purpose of insurance cover and a maximum amount of up to Rupees Five Lakhs is covered. For example, if an individual has an account with a principal amount of Rs.4,90,000/- plus accrued interest of Rs.9,000/- the total amount insured by the DICGC would be Rs.4,99,000/-. If, however, the principal amount in that account was Rs.5,00,000/-, the accrued interest would not be insured, not because it was interest but because that was the amount over the insurance limit. If an individual also opens other deposit accounts in his capacity as a partner of a firm or guardian of a minor or director of a company or trustee of a trust or a joint account, say with his/her spouse, in one or more branches of the bank then such accounts are considered as held in different capacity and different right. Accordingly, such deposits accounts will also enjoy the insurance cover up to Rupees Five Lakhs separately. All funds held in the same type of ownership at the same bank are added together before deposit insurance is determined. If the funds are in different types of ownership or are deposited into separate banks, they would then be separately insured. If individuals open more than one joint accounts in which their names are not in the same order for example, A, B and C; C, B and A; C, A and B; A, C and B; or group of persons are different say A, B and C and A, B and D etc. then, the deposits held in these joint accounts are considered as held in the different capacity and different right. Accordingly, insurance cover will be available separately up to Rupees Five Lakhs to every such joint account where the names appearing in different order or names are different. If a bank goes into liquidation, DICGC is liable to pay to the liquidator the claim amount of each depositor up to Rupees Five Lakhs within two months from the date of receipt of claim list from the liquidator. The liquidator has to disburse the claim amount to each insured depositor corresponding to their claim amount. If a bank is reconstructed or amalgamated / merged with another bank: The DICGC pays the bank concerned, the difference between the full amount of deposit or the limit of insurance cover in force at the time, whichever is less and the amount received by him under the reconstruction / amalgamation scheme within two months from the date of receipt of claim list from the transferee bank / Chief Executive Officer of the insured bank/transferee bank as the case may be. The DICGC while registering the banks as insured banks furnishes them with printed leaflets for display giving information relating to the protection afforded by the Corporation to the depositors of the insured banks. In case of doubt, depositor should make specific enquiry from the branch official in this regard. Banks have the right to set off their dues from the amount of deposits. The deposit insurance is available after netting of such dues. Deposit insurance premium is borne entirely by the insured bank. The deposit insurance scheme is compulsory and no bank can withdraw from it. The Corporation may cancel the registration of an insured bank if it fails to pay the premium for three consecutive half year periods. In the event of the DICGC withdrawing its coverage from any bank for default in the payment of premium the public will be notified through newspapers. Registration of an insured bank stands cancelled if the bank is prohibited from receiving fresh deposits; or its license is cancelled or a license is refused to it by the RESERVE BANK; or it is wound up either voluntarily or compulsorily; or it ceases to be a banking company or a co-operative bank within the meaning of Section 36A(2) of the Banking Regulation Act, 1949; or it has transferred all its deposit liabilities to any other institution; or it is amalgamated with any other bank or a scheme of compromise or arrangement or of reconstruction has been sanctioned by a competent authority and the said scheme does not permit acceptance of fresh deposits. In the event of the cancellation of registration of a bank, deposits of the bank remain covered by the insurance till the date of the cancellation. On liquidation etc. of other de-registered banks i.e., banks which have been de-registered on other grounds such as non-payment of premium or their ceasing to be eligible co-operative banks under section 2(gg) of the DICGC

Bank Deposit Insurance Read More »

Options

Let’s say there’s a farmer who cultivates wheat and there is a baker who needs wheat as an input for making bread. The farmer thinks that the price of wheat which is currently trading at Rs.100/- could fall to Rs.90/- in 3 months. The baker on the other hand feels that the price of wheat on the other hand might become Rs.120/- in 3 months. In such a case both of them get together and sign a contract which says that at the end of 3 months the farmer would sell wheat to the baker at Rs.110/-. Thus, the farmer is protected against possible fall in prices. And the baker is protected against the price of wheat going beyond Rs.110/-. Such a contract is called a Futures contract. In a Futures contract both parties are obliged to honor the contract and there is no escape route for either party. But what if the contract gives the farmer the “option” of either Selling his produce to the baker at the pre agreed price of  Rs.110/- or choosing to exit the contract and selling the produce in the open market or wherever he deems fit. Thus, he would not be obliged to honor the contract made with the baker on the date of settlement. Such a contract which gives the farmer the option of either executing the contract or exiting it is known as an “Options” contract. But the farmer obviously cannot get this privilege just like that. He obviously has to pay a premium for exercising this facility. Now, let’s say that after 3 months the price of wheat reaches Rs.120/-. In this case the farmer quite obviously will want to exit the contract so that he is free to sell his produce in the open market for Rs.120/-. Thus, while the farmer gets away the baker is left high and dry and has no other option but to buy from the open market at Rs.120/-. But it is not such a bad situation for the baker as it appears as he gets compensated by the farmer for having been a party to the “Options” contract. This compensation  in the form of price is called the “Option premium” that the farmer has to pay for the Options contract and quite evidently it would be a small amount. Let’s say in our case the amount is Rs.2/-. So, the farmer is obliged to pay the baker Rs.2/- as he has chosen to opt out of the contract. Thus, although the baker has no other option left but to go to the open market and purchase wheat at Rs.120/-, he does get the benefit of  Rs.2/- as compensation for being a party to the Options contract. So even if the price is Rs. 120 in the open market, for him the effective price turns out to be Rs.120 – Rs.2 = Rs.118/-. So, by simply participating in the contract he too stands to gain something. As far as the farmer is concerned it is a win – win scenario for him by participating in the contract. Had the prices fallen to Rs.90/- as he had anticipated he would have executed the Options contract. But since prices rose to Rs.120/- he chose to exit the contract. Thus, he is blessed with the Option by signing such a contract. It is important to understand that in an Options contract only one party gets the privilege to exercise the option while the other party is obliged to honor the option chosen. Thus, in our case the farmer has the option to either execute or exit the contract whereas the baker is obliged to honor the decision of the farmer. A contract such as this where only the seller of the commodity gets the option to either exercise or exit the contract is known as “Put” option. There is another option which is called a “Call” option. Even in an Options contract both parties land up achieving their goals and their interest is protected. The farmer stands to gain the most by getting to exercise a choice that benefits him the most. The baker too benefits by being a party to the contract due to the compensation he receives from the farmer for not honoring the contract. The baker due to the compensation receives wheat from the open market at an effective price of Rs.118/- And hence is better off than the ordinary or spot buyer who would have to pay Rs.120/-. Thus, in a sense both parties landed up getting some gains by being parties to the “options contract”. However, unlike in a “Futures” contract, in the “Options” contract one party gains more than the other party. Takeaways, Options are financial derivatives that give buyers the right, but not the obligation, to buy or sell an underlying asset at an agreed upon price and date. Call options and put options form the basis for a wide range of option strategies designed for hedging, income, or speculation. Options are versatile financial products. These contracts involve a buyer and seller, where the buyer pays a premium for the rights granted by the contract. Call options allow the holder to buy the asset at a stated price within a specific timeframe. Put options, on the other hand, allow the holder to sell the asset at a stated price within a specific timeframe. Each call option has a bullish buyer and a bearish seller while put options have a bearish buyer and a bullish seller.

Options Read More »