Financials

Current Account Deficit

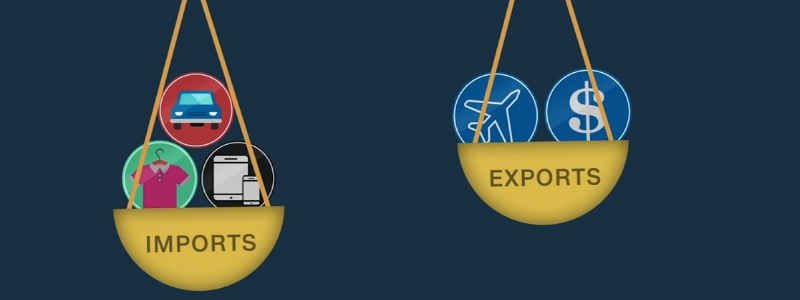
Suraj and Vipin travel together to work by train every day. As a usual morning practice, Vipin was reading a business paper when he came across the term \’Current Account Deficit\’. He wondered what it meant and asked Suraj to explain. Suraj tells him that if he answers a few questions, the meaning of the term Current Account Deficit will get clear. Suraj asks Vipin to name the sources of his income. Vipin identifies sources of income as Salary, Interest income from Fixed Deposits and Dividends from Mutual Funds. On hearing this, Suraj says, “Ok. But how about festival grants and birthday gifts received in cash?” Vipin agrees “Yes, sometimes”. Suraj then asks Vipin to list his expenses? On hearing this Vipin promptly responds, “Monthly house expenses, Children\’s school fees, Birthdays & Anniversary, occasional shopping and medical expenses.” Suraj then explains, “Now assume your expenses exceed your income this month. Then what will you do?” Vipin after a pause says, “Oh… then I will have to borrow money from someone.” Suraj continues to say, “Exactly. When your expenses exceed income, it is known as \’Deficit\’. And then you become indebted to the lender who lends you money.” “Ok. That is easy to understand.” says Vipin. Suraj continues explaining, “Similarly, Current Account for a country is expressed as the difference between the value of EXPORT of goods and services and the value of IMPORT of goods and services. In this context exports are “earnings” while imports are like “expenses”. A deficit then means that the “expenses” of the country are more than the income. In other words, the country is importing more goods and services than it is exporting. Current account also includes net income (such as interest and dividends from Capital Inflows or Outflows) and transfers from abroad (such as Workers\’ Remittances, Foreign Donations, Aids & Grants and Official Assistance), which are usually a small fraction of the total. A deficit implies that India is a net debtor to the world. The formula of the Current Account Balance (CAB) CAB = X – M + NI + NCT X          =          Exports of goods and services M         =          Imports of goods and services NI        =          Net income abroad    [Salaries paid or received, credit / debit of income from FII & FDI etc.] NCT     =          Net current transfers [Workers\’ Remittances(unilateral), Donations,Aids & Grants, Official Assistance and Pensions etc.]

Current Account Deficit Read More »

Fiscal Stimulus

Recession is the best time for some people to go on a vacation. They assume that by the time they come back, things will be back to normal. But for the saviors of the world economy, recession is the time to work overtime. They test various methods to get the economy back on its feet. One of the methods used is that of providing a fiscal stimulus package. Fiscal stimulus package? How can it stop recession? Well, you may have heard the name of John Maynard Keynes, the well-known British economist of the 20th century. The whole idea of fiscal stimulus is based on his analysis of factors that cause recession. During the Great US Depression of the 1930s, he wrote his most important work, The General Theory of Employment, Interest, and Money. What was it all about? Keynes focused his analysis on factors affecting output and growth in an economy. He asked, what decides the output in an economy? He said that output in any economy is decided by people who spend money. People like you and me who earn money with one hand and spend it with the other ultimately decide how much goods and services are going to be produced in our economy. If the demand of a product is less, then by the simple logic of demand and supply, the price of that product should fall. But it is difficult for firms to vary the price of their products frequently. For example, your baker may have to change the price of his bread every day if he goes strictly by demand and supply. Changing the price of goods every day is not a very happy way of doing business. Neither the baker nor his customers would be happy if prices just kept on changing forever. What options, then, does the baker have? He can let the price of the bread remain the same and reduce his production in response to lower demand. He can then meet the demand at the preset price by matching his supply with the demand. This is how demand affects output and growth in an economy. How can we use this understanding to fight recession? As per Keynesian analysis, the problem of recession is not due to lack of productive capacity in the economy. The factories have not lost their ability to produce goods, the real problem is due to insufficient spending to support the normal level of production. So, the solution is obvious. If the fall in demand leads to a fall in production, then we need to do something that can push up demand. What can one do about that? We have two options. The first option, as recommended by Keynes, is to increase Government spending, which works as the most effective way of increasing the aggregate demand of goods and services. The second option is to increase the disposable income in the hands of people by cutting taxes. Put money in the hands of people and even the most pessimistic person starts making new plans. It is believed that people will use part of their extra income on consuming extra goods and services. This creates what is known as a multiplier effect. You buy the bread of the baker, your baker in turn buys milk, and the milkman buys something else — in this manner, the game of passing the penny keeps going. Fiscal stimulus works as an instant source of energy. However, the timing of a fiscal stimulus and its size is most crucial for its success. To Sum Up What: Fiscal stimulus can be used as a tool for fighting recession. How: Increase in government spending coupled with tax cuts can lead to increase in aggregate demand and growth in the economy. Who: John Maynard Keynes, the well-known British economist, was a prominent advocate of the use of fiscal stimulus.

Fiscal Stimulus Read More »

Organic & Inorganic Growth

Let us imagine there is a “bhelpuri Wala” who has a stall in a famous marketplace. He has been in this business for a long time and has quite a reputation. He sells “Bhel” under the brand “Crispy Snacks.” With time his business starts growing. He soon has money to stock other products. So, he introduces Sev Puri, Dahi Puri, Chaat etc. under the “Crispy Snacks” banner. The addition of new products gives further impetus to his business. This kind of growth is what we typically call, “Organic” growth. It is growth that comes from within the same business. As time goes by and his business grows further, he starts accumulating a lot of money. With all the money at his disposal, he gets more ambitious and wants to invest the money in his business to make it grow even faster. But he realizes that even if he invests the money, it would not be possible to grow the business within a short span. So, he starts to think of another approach to attain quick growth. He hits upon another idea. He purchases four new snack shops in the same area lock stock and barrel and brings them all under the “Crispy Snacks” banner. Such growth which can be purchased, and which is essentially from the outside is known as “inorganic” growth.

Organic & Inorganic Growth Read More »

Net Present Value of Money

Two friends A and B were sitting under a tree and engrossed in some discussion. They had a problem on hand. A’s father had agreed to pay him Rs 1 Cr. to help him settle in life But B’s father had made another arrangement. Not sure of B’s maturity, he was promised Rs 1.2 Cr after 3 years. B was showing off his offer to A saying that his father had given a much better deal. However, A not ready to give up argued that his deal was better because he was getting paid immediately. Now this argument went on for several hours till it was evening. However, this problem was just not getting resolved. This argument was taking place just in front of my office. Seeing these guys’ argument stretch across the entire day, I got curious and walked up to them to understand their problem. When they explained their positions, I offered to intervene provided they stopped their argument. I told them that in order to compare their situations it would be necessary to find out the net present value of the Rs 1.2 Cr that B had been promised after 3 years. Here, it is important to understand that the purchasing power of money reduces almost every day due to the rise in price of goods and services due to inflation. Therefore, the value of Rs 1.2 Crores after 3 years needs to be discounted by an assumed rate of inflation. Let us say the rate of inflation we assume is 8%per annum! The formula for calculating the net present value or NPV = Amount / (1+R) ^n where Amount is the Rs 1.2 Cr that B would get after 3 years. “R” is the rate of assumed inflation and “n” stands for a 3-year period. So, using the formula we get NPV = 1.2/ (1+.08) ^3 =  1.2/ (1.08) ^3 = Rs 95 lakhs Thus, I told B that the net present value of the money promised to him is Rs. 95 lakhs and hence it less than what A is receiving. I thus told them that one should simply not get blindly excited by the amount being offered in the future. Inflation is our constant companion and hence, it is imperative to calculate the present value of all future cash flows for comparison.

Net Present Value of Money Read More »

Quality at Reasonable Price

Quality at Reasonable Price, is investing in well-managed businesses that exhibit superior returns, generate strong cash flow and are available at attractive valuations. QARP investors, think in terms of economic value, which a business can create by delivering growth with superior returns. Quality at Reasonable Price ensures you invest in quality companies. Buying quality stocks at a reasonable price reduces the chances and extent of a fall in your net worth and thereby dramatically increase your chances of staying invested. Wealth is the natural outcome of staying invested and compounding growth of your investment. QARP can be based on the careful consideration of both investment risk (quality) and expected returns (price). This produce a portfolio that is style unaware and can include both value and growth, depending on the risk / return. Generally, investment is done in high quality companies, particularly those with suitable dividends which are available at reasonable price. This leads to improve long-term investor returns, while also providing downside protection in adverse markets.

Quality at Reasonable Price Read More »

Growth at a Reasonable Price

Growth at a reasonable price (GARP) is an equity investment strategy that combines growth and value investing attributes. It is a fundamental driven investment strategy that balances pure growth and pure valuation, as the former tends to invest in high-growth, yet expensive stocks, while the latter may take a long-term investment to pay off. GARP investors are looking for a stock that is trading for slightly less than its estimated value that also has earnings growth potential. GARP investors do not necessarily stick to specific ratios or valuation metrics to help them select stocks. GARP investors usually do follow price/earnings (P/E = current share price/earnings per share) valuations in order to find investments that have been slightly discounted by the market. For instance, if XYZ Co., is currently trading at Rs.200 and its forecast earnings per share is Rs.12.5, the stock is trading at 16x its earnings. Depending on the industry, this P/E ratio could be high or low. A GARP investor would compare XYZ’s multiple to the multiples of other companies operating in the same industry. Typically, a P/E ratio in the 10x-20x range is reasonable for a GARP investor. Higher P/E multiples tend to indicate that the business is overvalued. GARP investors also look for low price/book ratios (P/B = current share price/book value per share) and a PEG ratio of less than 1 (PEG = P/E ratio/projected growth in earnings). While the criteria used to identify a quality company can differ, some shared attributes typically include Sustainable business model Sustainable business model and a strong competitive advantage are better positioned to maintain their market position and generate consistent profits over time. Consistent earnings growth Investors are typically more attracted to companies that have a track record of consistent earnings growth, as this is indicative of the company’s ability to sustain its growth in the future. Strong financials Companies that possess a robust financial position, characterised by a low level of debt, a healthy balance sheet, and strong cash flow, are typically regarded as being of higher quality when compared to those with weak financials. Management quality Companies with competent management team that have a proven track record of making sound business decisions are generally considered to be of higher quality. Since, GARP strategy is a hybrid solution for growth and value stock-picking, a GARP investor will experience a combination of returns.  For instance, a value investor will do better when markets are falling, while a growth investor will do best as markets rise. A GARP investor will be somewhere in the middle.

Growth at a Reasonable Price Read More »

Price to Book Ratio

Simply speaking, the Price-to-book ratio (i.e., P/B ratio) is the ratio of Price of a stock to that of the value of its tangible assets and is used to compare a stock\’s market value to its book value. Book value is an accounting term denoting the tangible value of the company. It is the total tangible value made up of the assets of the company. Intangibles like “brand” name and “goodwill” are not a part of the book value. It is calculated as: P/B Ratio        =                                  Stock Price                                     Total Assets – Intangible Assets and Liabilities Therefore… What this means is that the lower the P/B, the better the value. A lower P/B ratio could mean the price that the market is quoting does not justify the current value of the assets of the company that it presently holds. One must remember that people pay a price of a stock not only based on its current assets but also based on future prospects of the company or industry in which it operates. Secondly… The value of intangibles such as goodwill, brand name, management team etc. can be considerable and stock buyers pay quite a premium for such intangibles. Hence, if the intangibles are valuable or if people believe that the company has good prospects in the future, they normally would be willing to pay a much higher price as compared with the value of its current assets. Hence… Despite positive outlook for the industry, if the P/B of the company is quoting low, it calls for more introspection about the company. Something could be fundamentally wrong in the company for the market to be quoting a low price. Perhaps the management is unstable or there is a leadership problem or there could be underlying labour problems in the company or any other factor that perhaps cannot be easily determined. But how is it useful to you & me? This ratio guards you against paying a very high price for a company because it compares the price to what you could recover if the company were to suddenly close down. Hence, while paying a price for a stock one should keep in mind its tangible and intangible assets on one hand and the prospects of both the company as well as the industry on the other hand. As with most ratios, it varies a fair amount by industry. For example… In the telecom sector, this ratio can be expected to be high in keeping with the bright prospects of the industry. Further to this, if the company is a leader in the industry, like Reliance Jio, the market will be able to sustain a high P/B ratio. This is one reason why the stock price of companies like Reliance Jio is high as compared to its book value. Therefore… A higher P/B ratio implies that investors expect management to create more value from a given set of assets, all else being equal. P/B ratios do not, however, directly provide any information on the ability of the firm to generate profits or cash for shareholders.  To Sum Up What: The Price-to-book ratio (i.e., P/B ratio) is used to compare a stock\’s market value to its book value. How: It is calculated by dividing the current closing price of the stock by the latest quarter\’s book value per share. Why: This ratio guards you against paying a very high price for a company because it compares the price to what you could recover if the company were to suddenly close down.

Price to Book Ratio Read More »

NACH

The history of automated payments in India started with Electronic Clearing Service (ECS). ECS was a revolution when it was introduced, and it was able to replace a lot of manual work, especially in salary and pension disbursements. As demand increased, ECS became inadequate to meet the needs. So, then NACH (National Automated Clearing House) was introduced. NACH payment refers to the automatic debit of funds from one bank account and credit to another bank account without manual intervention. You can avail the service by filling in the NACH mandate form. NACH is faster, easier, and entirely online. NPCI National Payments corporation of India created NACH to make periodic payments easier. Banks, corporates, companies, governments, and even mutual fund houses and brokers can make use of NACH to make handling payments easier. Once you sign the NACH mandate and the same is presented to the bank, payments will be automatically deducted from your account every month. For example, if you start an SIP with any Mutual Fund, you will have fixed monthly instalments on a fixed date, so the amount will be automatically debited every month on a fixed date. Your effort is limited to keeping the fixed amount so that the bank can remit in time. As far as the bank is concerned, the process is automatic until the end of the NACH period. NACH payment mandate gives an entity the right to withdraw a certain amount of money from your account till the date it\’s cancelled. This enables the automatic payments that were mentioned above. You can cancel or modify the NACH mandate. It has to be noted that the bank take time to honour your request. Charges related to NACH may vary for different Banks. If a NACH mandate or a payment request is failed due to insufficient funds, the bank may charge a penalty for the same. NACH is one of the most helpful payment tools that save corporates and individuals time and money. Ensure you read your NACH mandate carefully before signing to ensure the details are correct.

NACH Read More »

Cheque Truncation System (CTS)

CTS stands for Cheque Truncation System. It is online cheque clearing system undertaken by the Reserve Bank of India (RBI) for faster clearing of cheques. CTS is an online image-based cheque clearing system where cheque images and Magnetic Ink Character Recognition (MICR) data is captured at the collecting bank branch and transmitted electronically. The earlier system relied on the MICR. MICR is the machine readable nine-digit code found at the bottom of every cheque leaf. This code helped in bank and branch-wise sorting of cheques but physical delivery of cheques still continued. In the new system, cheque truncation eliminates the need to move the physical instruments across branches. This results in reduction of time required for payment, cost of transit and delays in processing. How does it work? In the earlier system, you presented a cheque to your bank, which sent the cheque to a clearing house, after which the money was credited to your account. It usually took 3 days on an average to clear cheques as it involved physical movement of cheques. How CTS changed it? CTS clears cheques based on electronic images. Physical transfer of cheques between banks has ended. The new system allows clearing of cheques in 1 day on an average. Benefits of CTS Time, money and manpower spent on physical movement of cheques from banks to clearing house are eliminated. Clearing related frauds become less probable. Possibility of cheques lost in transit is eliminated.  Highlights of CTS cheques All CTS cheques carry a watermark, with the words ‘CTS-INDIA’, which become visible when held against any light source. Pantograph (wavelike design) with hidden / embedded word ‘VOID’ become clearly visible in photocopies of a cheque. ‘CTS 2010’ is printed on the left-hand side of cheque leaf near perforation. To conclude, CTS has brought elegance to the entire activity of cheque processing & clearing and offers several benefits to banks in terms of cost and time savings, including human resource rationalization, cost effectiveness, business process re-engineering and better customer service.

Cheque Truncation System (CTS) Read More »

Market Stabilisation Scheme

When there is too much of liquidity of money in the market, it can cause inflation. Central Bank then intervene by releasing Market Stabilisation Scheme bonds (MSS Bonds) to control inflation. MSS Bonds are issued with the objective of providing the RBI with a stock of securities with which it can intervene in the market for managing liquidity. So, what are MSS bonds and how do they help in controlling inflation. MSS bonds control inflation by sucking up the excess liquidity. Let’s try and understand through a story. Imagine the situation when summer holidays start. It’s fun times for the kids and they hardly stay at home. From the start of the day till the end of the day they are out playing, watching movies, going out with friends, eating out, shopping, etc. etc. Only by the end of the day they return to sleep. And moreover, when they are out of the house, they are spending their pocket money. Imagine a city where thousands of kids have invaded the streets, the restaurants, the movie halls, the game parks, the shopping malls etc. Seeing this huge surge in demand, the owners/management of malls, multiplexes, restaurants, game parks raise their prices. This is quite natural as price is directly proportional to demand. So, there are too many kids in the market and hence prices start to rise. In a sense these kids are like the excess liquidity in the markets. Excess liquidity too causes prices to go up just as excess kids cause prices to increase due to excess demand for the same supply. Now let’s imagine all the parents get together and express their displeasure about their kids being out of the house all the time. They start putting together plans that would make their kids stay longer at home. They hit upon an idea! They print a large number of pamphlets in which they write a message for all the kids. The message says, “ Kids if you agree to spend more time at home, we will lift all restrictions on watching television, listening to music, reading books, eating chocolates. You can also call your friends at home and play any indoor games including video games.” Then they distribute these pamphlets in the market where the kids are having fun. When the kids read the message, it pleases them. They start thinking of home as a much better place as compared to be out in the hot sun. They think of their air-conditioned homes, the pampering that their parents would do, the fun that they could have with friends at home, the watching of TV and surfing of the internet without any restrictions. The house with no restrictions and lots of love is the home they now want to go to. All of a sudden, the kids start moving into their homes and start emptying the market. The mall owners, theatre owners, restaurant owners and others are shocked or surprised at the sight of the disappearing kids. They try their best to influence them to stay on and spend in the market. They start offering discounts and lower their prices as well. But the kids are not willing to stay back any more and simply head for their homes. After the kids disappear the demand falls and the various merchants have no option but to further drop prices so that there is some off-take at least. Now in this example the pamphlets that were printed by the parents and released in the market are like the MSS bonds that are released by the central banks and just like the kids were sucked into their homes by the favorable promises made in the pamphlets in the same way the MSS bonds too, suck up liquidity by making people invest in these bonds due to favorable returns that are promised in these bonds. This is how MSS bonds are able to regulate liquidity in the market / economy which leads to controlling the prices of goods and services and brings down inflation.

Market Stabilisation Scheme Read More »